Tools in action - Monitoring a JHipster microservice architecture in practice
I gave this 25 minutes talk 3 times in 2018 at 3 different conferences (VoxxedDays microservice, JHipster Conf and Devoxx France). It has been enriching to do it several times to different audiences and being able to get more and more confident each time. It was also a good challenge to constrain the talk time to 25 min as I was initially planning for 45 min. It is much easier to get a a spot at conferences for a tools in action, so I think I will stick to this format in the future but maybe try to reduce the scope of what I want to present.
Video
Summary of the talk
After a brief overview of the problems encountered when monitoring microservices, I demonstrate how the JHipster Console can help you monitor a JHipster microservice architecture and how it provides an integrated solution for the the 3 ways of observability:
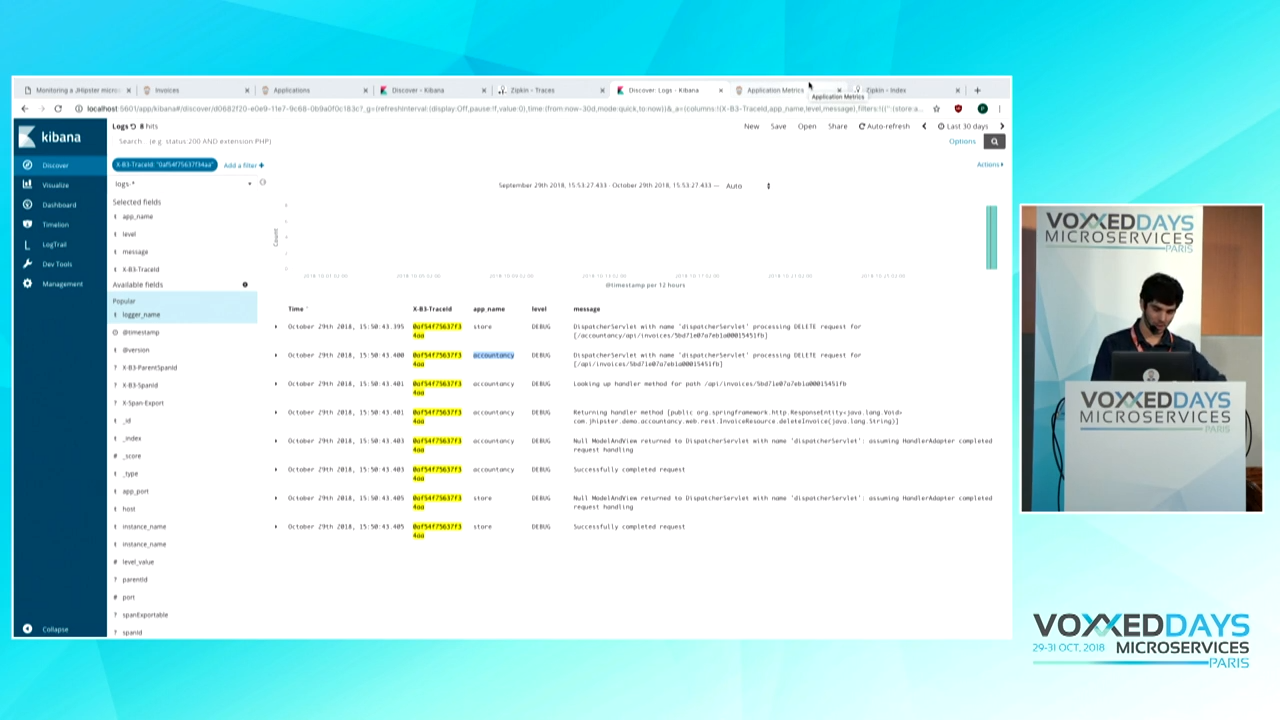
- Logs : Kibana and Elasticsearch are leveraged to view, aggregate and search logs.
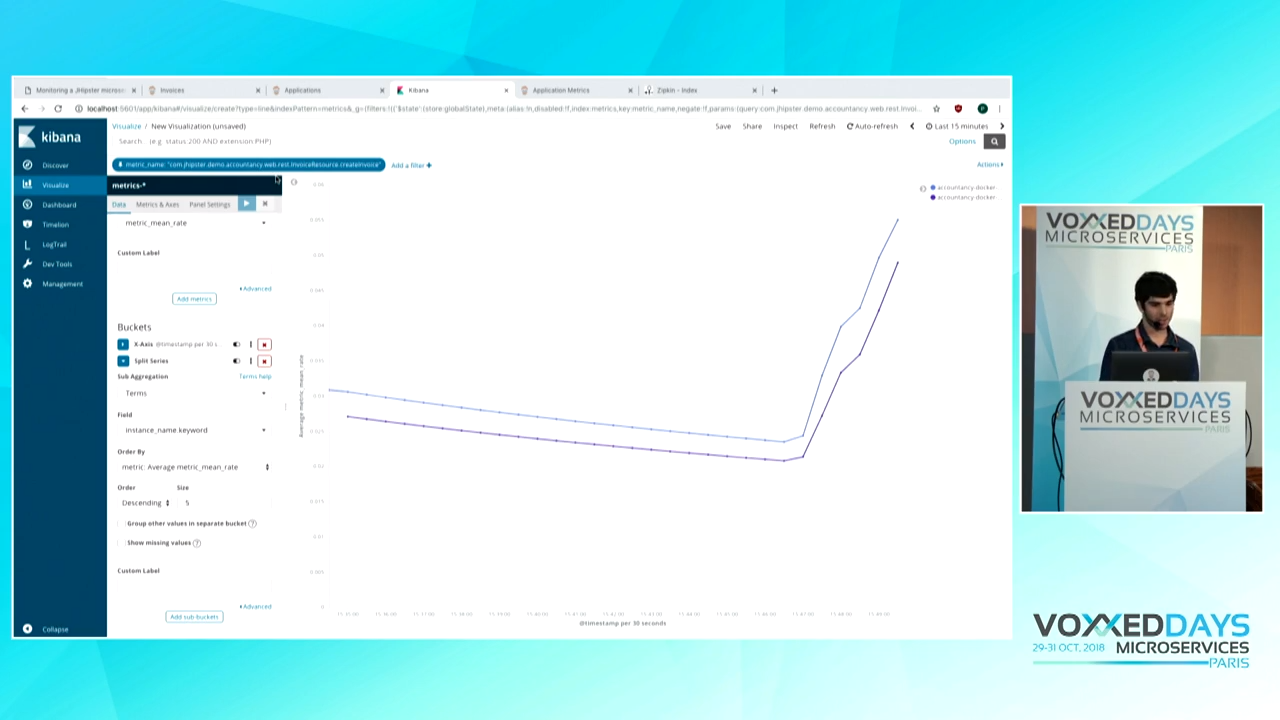
- Metrics : Internal application metrics can be graphed and studied using newer features of Kibana and Elasticsearch.
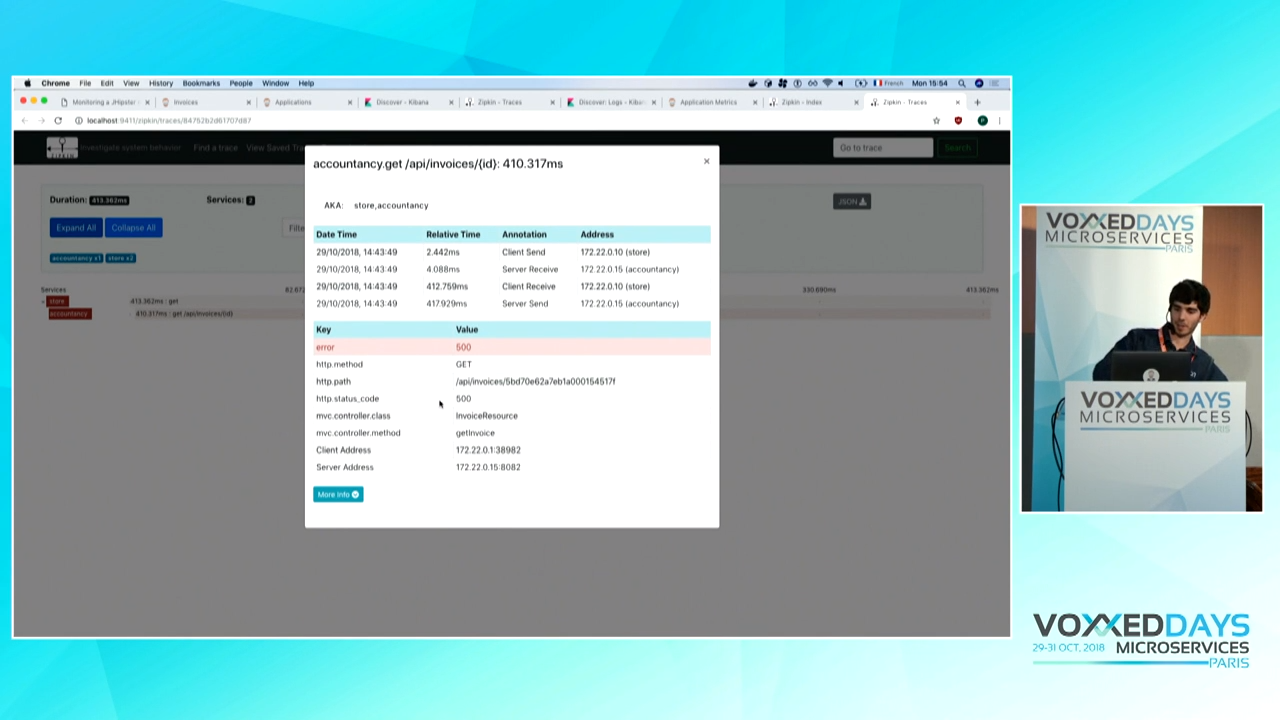
- Traces : By integrating the Zipkin UI and Kibana through dynamic links between the 2 UIs, one can easily jump between the distributed trace latency graph and the logs associated with a given Trace ID.
Links
Github repo
The code was published to pierrebesson/microservice-monitoring-tools-in-action-demo, it will allow you to run the demo locally with docker compose and everything working out of the box.
VoxxedDays Microservices (October 29th 2018)
Screenshots