The missing guide to Scalyr - the cheap and efficient log aggregation service
 Obligatory picture of log aggregation… in the real world ! (Image by Pexels from Pixabay)
- Introducing Scalyr
- Configuring log reporting for common use cases
- Understanding how to efficiently use Scalyr UI
- Conclusion
Introducing Scalyr
Scalyr is a little known log aggregation service offered as a SaaS. It can be compared to ELK or other log management solutions (Splunk, Papertrail, Datadog logs). It does offer fewer features and reduced full-text search capabilities but it focuses instead on being cheap, easy to set up and fast to use.
As of March 2020, the pricing of Scalyr is extremely interesting for small projects starting at 35$ / month for 1GB / day of logs. Moreover, Scalyr offers powerful tools to monitor the volume of logs you use and to keep your usage below the planned amount and prevent surcharge. When in need of scaling the volume of logs your applications produce, the pricing structure of Scalyr is set up such that the price you pay will increase linearly, ie. 35$ / month for 1GB / day then 70$ / month for 2GB / day.
All these considerations make Scalyr a compelling solution for log aggregation.
Configuring log reporting for common use cases
Let’s now see how to easily set up Scalyr in common scenarios. Please note that I’m using the Scalyr European server (https://upload.eu.scalyr.com) in my examples.
Traditional server setup
To install Scalyr on Linux machines, use the installer from the official instructions. Then configure the agent in /etc/scalyr-agent-2/agent.json as follows :
// Configuration for the Scalyr Agent.
// https://www.scalyr.com/help/scalyr-agent-2
{
    scalyr_server: "https://upload.eu.scalyr.com",
    api_key: "<write_api_key>",

    server_attributes: {
       serverHost: "<server_name>",
       env: "<environment_name>"
       // You can add whatever additional fields you want to set as metatadata to your logs

    },

    // Disable metrics collection as it will increase the volume of logs you pay for
    implicit_metric_monitor: false,
    implicit_agent_process_metrics_monitor: false,

    logs: [
        {
            path: "/path/to/file.log",
            rename_logfile: "<log_file_name>"
            attributes: {parser: "<parser_name>"}
        }
    ],

    monitors: [
    ]
  }
| Key | Explanation |
|---|---|
<write_api_key> |
API key that can be created in Scalyr administration UI |
<serverHost_name> |
Metadata used in Scalyr query UI to locate the server your log originated from |
<logfile_name> |
Metadata used in Scalyr query UI to locate the logfile your log originated from |
<parser_name> |
The log parser to use, those can be defined in Scalyr administration UI |
<environment_name> |
Custom metadata that I use to index logs coming from different environments |
Docker-compose setup
If you use docker-compose to orchestrate docker containers on a single host, the scalyr agent is able to plug into the docker logging driver and forward the logs to Scalyr servers. To make it work, make sure to bind mount the docker socket and container volumes to the agent container as shown below so that it can access the relevant information from the docker daemon.
version: '3'

services:
  hello-world:
    image: hello-world
    labels:
      - "com.scalyr.config.log.parser=<parser_name>"
      - "com.scalyr.config.log.serverAttributes.serverHost=<server_name>"
      - "com.scalyr.config.log.attributes.serverHost=<server_name>"
      - "com.scalyr.config.log.attributes.env=<environment_name>"

  scalyr-agent:
    image: scalyr/scalyr-agent-docker-json:2.0.53
    environment:
      SCALYR_SERVER: "https://upload.eu.scalyr.com"
      SCALYR_API_KEY: "<write_api_key>"
      SCALYR_LABELS_AS_ATTRIBUTES: "true"
      SCALYR_IMPLICIT_METRIC_MONITOR: "false"
      SCALYR_IMPLICIT_AGENT_PROCESS_METRICS_MONITOR: "false"
      SCALYR_REPORT_CONTAINER_METRICS: "false"
      // Environment variables configuration for the Scalyr Agent
      // https://app.scalyr.com/help/scalyr-agent-env-aware
    volumes:
      - /var/run/docker.sock:/var/scalyr/docker.sock
      - /var/lib/docker/containers:/var/lib/docker/containers
Note that this setup can work for any docker containers running on the host as long as you set the correct docker labels on the container, for example by using the -l/--label flag of the docker container run command.
Kubernetes setup
One of the areas where Scalyr shines the most is its ability to automatically capture logs from applications running in a Kubernetes cluster by running an agent on all Kubernetes nodes through a DaemonSet.
Sadly, Scalyr does not yet offer an official Helm chart, so I suggest that you create one yourself based on the YAML configuration present in the Scalyr Kubernetes installation documentation.
Here is the configuration you need (as of March 2020).
- scaly-agent-secret.yaml
apiVersion: v1
kind: Secret
metadata:
  name: scalyr-api-key
  namespace: scalyr-agent
type: Opaque
data:
  scalyr-api-key: <base64_encoded_scalyr_api_key>
- scaly-agent-configmap.yaml
Here are the configuration settings that should produce the minimum volume of logs (but be aware that it will also disable a number of built-in dashboards). For more information, please refer to the Scalyr Kubernetes agent documentation.
apiVersion: v1
kind: ConfigMap
data:
  SCALYR_K8S_CLUSTER_NAME: <cluster_name>
  SCALYR_SERVER: "https://upload.eu.scalyr.com"
  SCALYR_IMPLICIT_AGENT_LOG_COLLECTION: true
  SCALYR_IMPLICIT_AGENT_PROCESS_METRICS_MONITOR: false
  SCALYR_IMPLICIT_METRICS_MONITOR: false
  SCALYR_REPORT_CONTAINER_METRICS: false
  SCALYR_REPORT_K8S_METRICS: false
  SCALYR_K8S_EVENTS_DISABLE: false
  SCALYR_K8S_INCLUDE_ALL_CONTAINERS: false
  SCALYR_K8S_EVENTS_DISABLE: "true"
metadata:
  name: scalyr-config
  namespace: default
- scalyr-agent-service-account.yaml:
Download the file from Scalyr github’s scalyr-service-account.yaml
- scalyr-agent-daemonset.yaml:
Download the file from Scalyr github’s scalyr-agent-2-envfrom.yaml)
Then you will need to add the following to the Kubernetes deployments for which you want to configure log reporting to Scalyr:
metadata:
   annotations:
      "log.config.scalyr.com/include": "true"
      "log.config.scalyr.com/attributes.parser": "<parser_name>"
Understanding how to efficiently use Scalyr UI
Viewing and searching logs
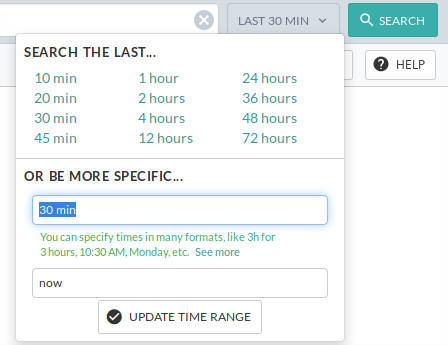
When viewing logs in Scalyr UI, the first thing you need to check is the time picker. It will let you choose the time range for which to view logs. It is very easy for beginners to forgot to use it so take some time to learn to use it.

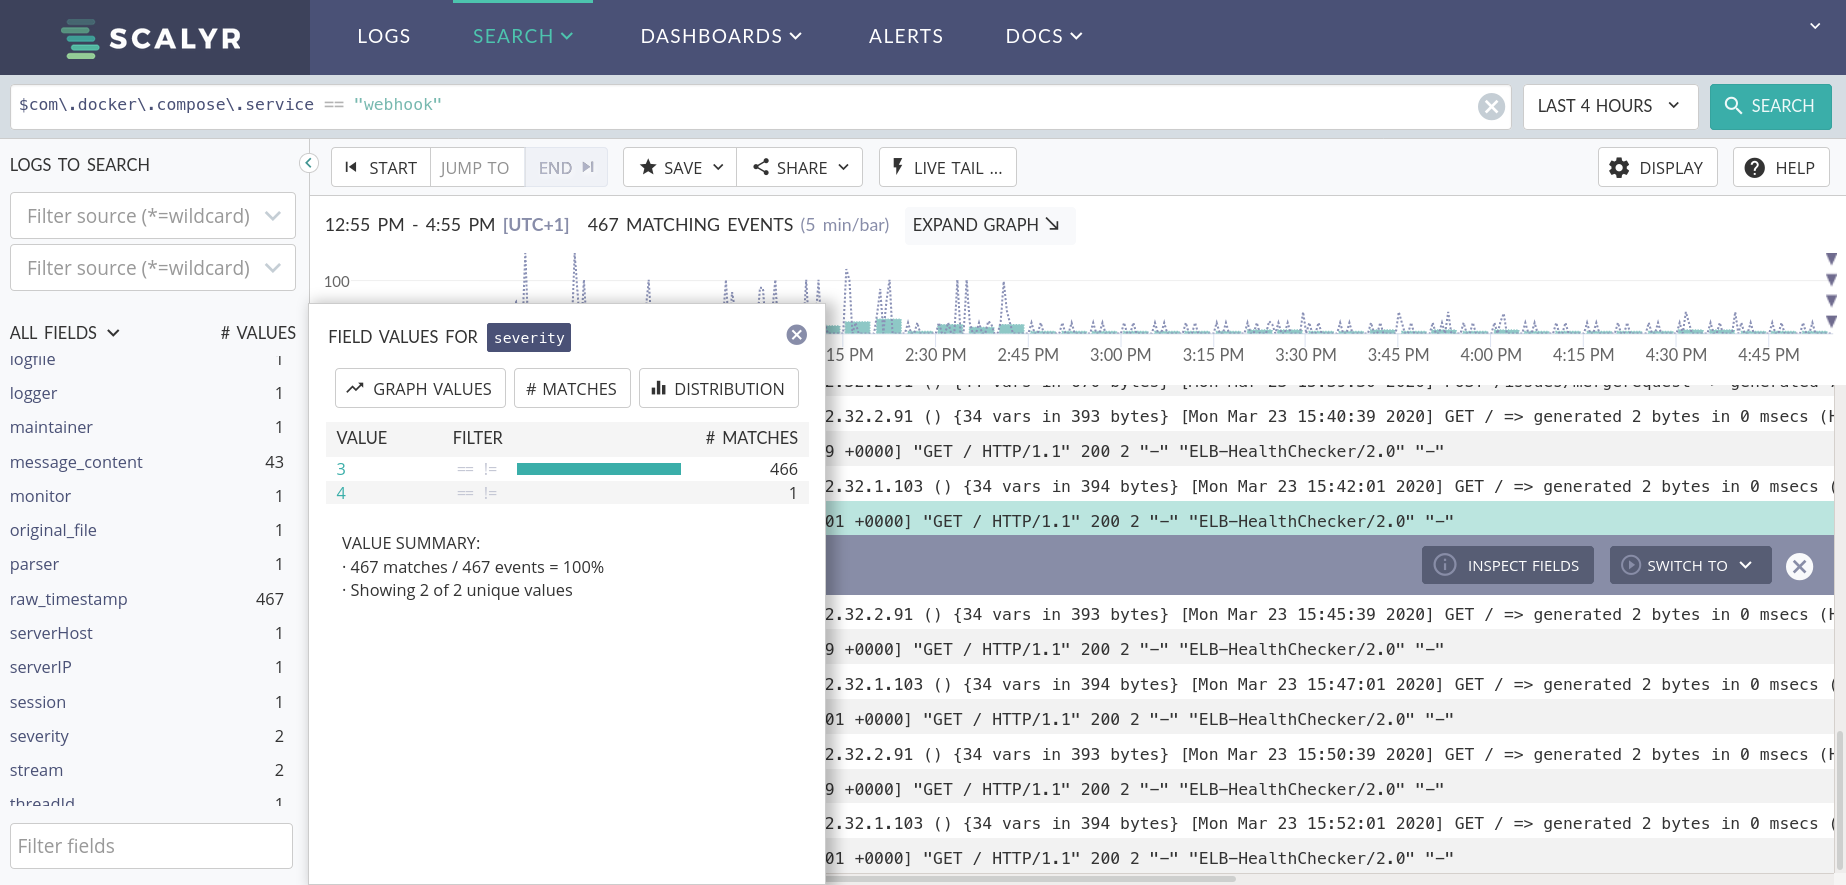
The next thing you need to learn about Scalyr UI is the two very confusing drop-down boxes on the left. Be careful they do not do what you think they do! Naively you might think that those help you locate logs by cluster and application respectively but that’s not always true depending on your configuration. What those two boxes actually do is provide a shortcut for running a simple filter on the following fields:
| Setup | First box | Second Box |
|---|---|---|
| Server agent | serverHost (as defined in agent.json) | logfile (as defined in agent.json) |
| Docker agent | serverHost (docker container id) | logfile (/docker/<user>_<docker_container_name>.log) |
| Kubernetes agent | k8s-cluster | k8s-deployment |

I have noticed a lot of confusion among our developers regarding those two magic boxes, especially on advanced setups combining different Scalyr deployment types. So I hope this explanation will be helpful for you and that Scalyr will improve their UX in the future to clear the confusion.

Lastly, you can use the section on the left to filter by field. Note that it is also possible to search with arbitrary text in the query bar but it does not always give good results so in my experience you should always filter using explicit fields and eventually add wildcards (* characters) in your queries.
Setting up a simple parser for Java applications
As an example, here is a simple Scalyr parser for a Java application. Note the use of a line grouper which is used to group the stack trace and the preceding log together.
{
  lineGroupers: [
    {
      start: "^[^\\s]",
      continueThrough: "^[\\s]+at"
    }
  ],
  formats: [
    {
      id: "java-logs",
      format: "$date$ $time$ $severity$ \\[$className$\\] $message_content$"
    }
  ]
}
The keywords: date, time and severity are actually Scalyr specific and will help your logs to be correctly indexed. The severity keyword actually corresponds to what we call “log levels” in the Java world and we have the following correspondence table:
| Java log level | Scalyr severity |
|---|---|
| TRACE | 1 |
| DEBUG | 2 |
| INFO | 3 |
| WARN | 4 |
| ERROR | 5 |
| FATAL | 6 |
This classification is actually very useful as it lets you run queries such as :
$severity == 5: Show only ERROR logs$severity != 1: Don’t show TRACE logs$severity >= 3: Show logs of levels INFO and above
How to monitor the volume of logs
The Billing plan administration page has everything you need to monitor the volume of logs received by Scalyr and to graphically set up email alerts. Recently they even added a Discard filter option which allows dropping logs following a certain pattern to manage the sudden spikes of “polluting” logs directly from the Scalyr console.
Conclusion
This post is an overview of everything you need to get started with log aggregation using Scalyr, however it falls short of more advanced subjects for which I will leave you to the official documentation if you want to learn more.